Gold as the Harbinger: A Century of Commodity Cycles (1928–2026)
Executive Summary
History reveals a persistent pattern in macro-finance: Gold is rarely just a shiny rock; it is the "canary in the coal mine." Since 1928, major upward revaluations in Gold have almost invariably preceded a broader secular bull market in commodities (energy, agriculture, and industrial metals).
As we navigate the economic landscape of 2026, understanding this lag effect—where Gold moves first, and commodities play catch-up—is crucial for asset allocation.
The Core Mechanism: Why Gold Leads
Before analyzing the timeline, it is vital to understand why this sequence repeats.
- Monetary Debasement: Gold reacts immediately to the expansion of money supply and loss of faith in sovereign debt. It is a monetary sensor.
- The Inflation Lag: Real assets (oil, copper, wheat) take longer to react because they are driven by physical supply chains and industrial demand.
- The Catch-Up: Once the currency is devalued (signaled by high Gold prices), producers of commodities must charge higher nominal prices to sustain operations, triggering a "Commodity Supercycle."
Historical Echoes: Three Major Cycles
1. The Great Depression & Revaluation (1928–1934)
The Trigger: Following the stock market crash of 1929, the global economy entered a deflationary spiral.
The Gold Event: In 1933-1934, President Roosevelt effectively devalued the US Dollar by revaluing Gold from $20.67 to $35.00 per ounce (an overnight increase of ~69%).
The Commodity Reaction: This devaluation broke the deflationary grip. While it took time, commodity prices (grains, cotton, metals) bottomed and began a reflationary trend that lasted until the onset of WWII.
Insight: Gold was repriced by policy first; raw materials followed as the dollar lost purchasing power.
2. The Stagflation Era (1971–1980)
This is the most famous example of the "Gold Lead."
The Trigger: In 1971, Nixon closed the Gold Window, ending the Bretton Woods system. The USD was no longer backed by hard assets.
The Gold Event: Gold exploded from $35 in 1971 to a peak of $850 in January 1980.
The Commodity Reaction:
- Oil: Quadrupled in 1973 (Embargo) and doubled again in 1979.
- Agriculture: Wheat and corn prices surged in the mid-70s.
The Lag: Gold started moving aggressively in the early 70s. The broadest commodity inflation (CRB Index) peaked later, around 1980.
Insight: Investors who bought commodities after Gold made its initial breakout generated massive real returns.
3. The Emerging Market Supercycle (2000–2011)
The Trigger: The Dot-com bust and the rise of China's industrial machine.
The Gold Event: Gold bottomed around $250 in 1999/2000 and began a steady climb, breaking $1,000 in 2008 and hitting $1,920 in 2011.
The Commodity Reaction: Oil lagged Gold initially but eventually surged to $147/barrel in 2008. Copper and Iron Ore hit all-time highs after Gold had already established a bull trend.
Insight: Gold signaled the weak dollar (post-2001 cuts), but China’s physical demand drove the commodity catch-up.
The Current Cycle: The "Great Debasement" (2020–2026)
We are currently living through the fourth major iteration of this pattern.
Phase 1: The Monetary Shock (2020–2021)
The COVID-19 stimulus injected trillions into the global economy. Gold reacted by hitting new highs (crossing $2,000) in August 2020, signaling that the currency had been diluted.
Phase 2: The Inflationary Spike & Geopolitics (2022–2024)
While Gold consolidated, commodities (Oil, Gas, Wheat) spiked due to the Russia-Ukraine war and supply chain breaks. However, central banks raised rates, temporarily suppressing commodity prices in 2023.
Phase 3: The Breakout & Divergence (2024–2026)
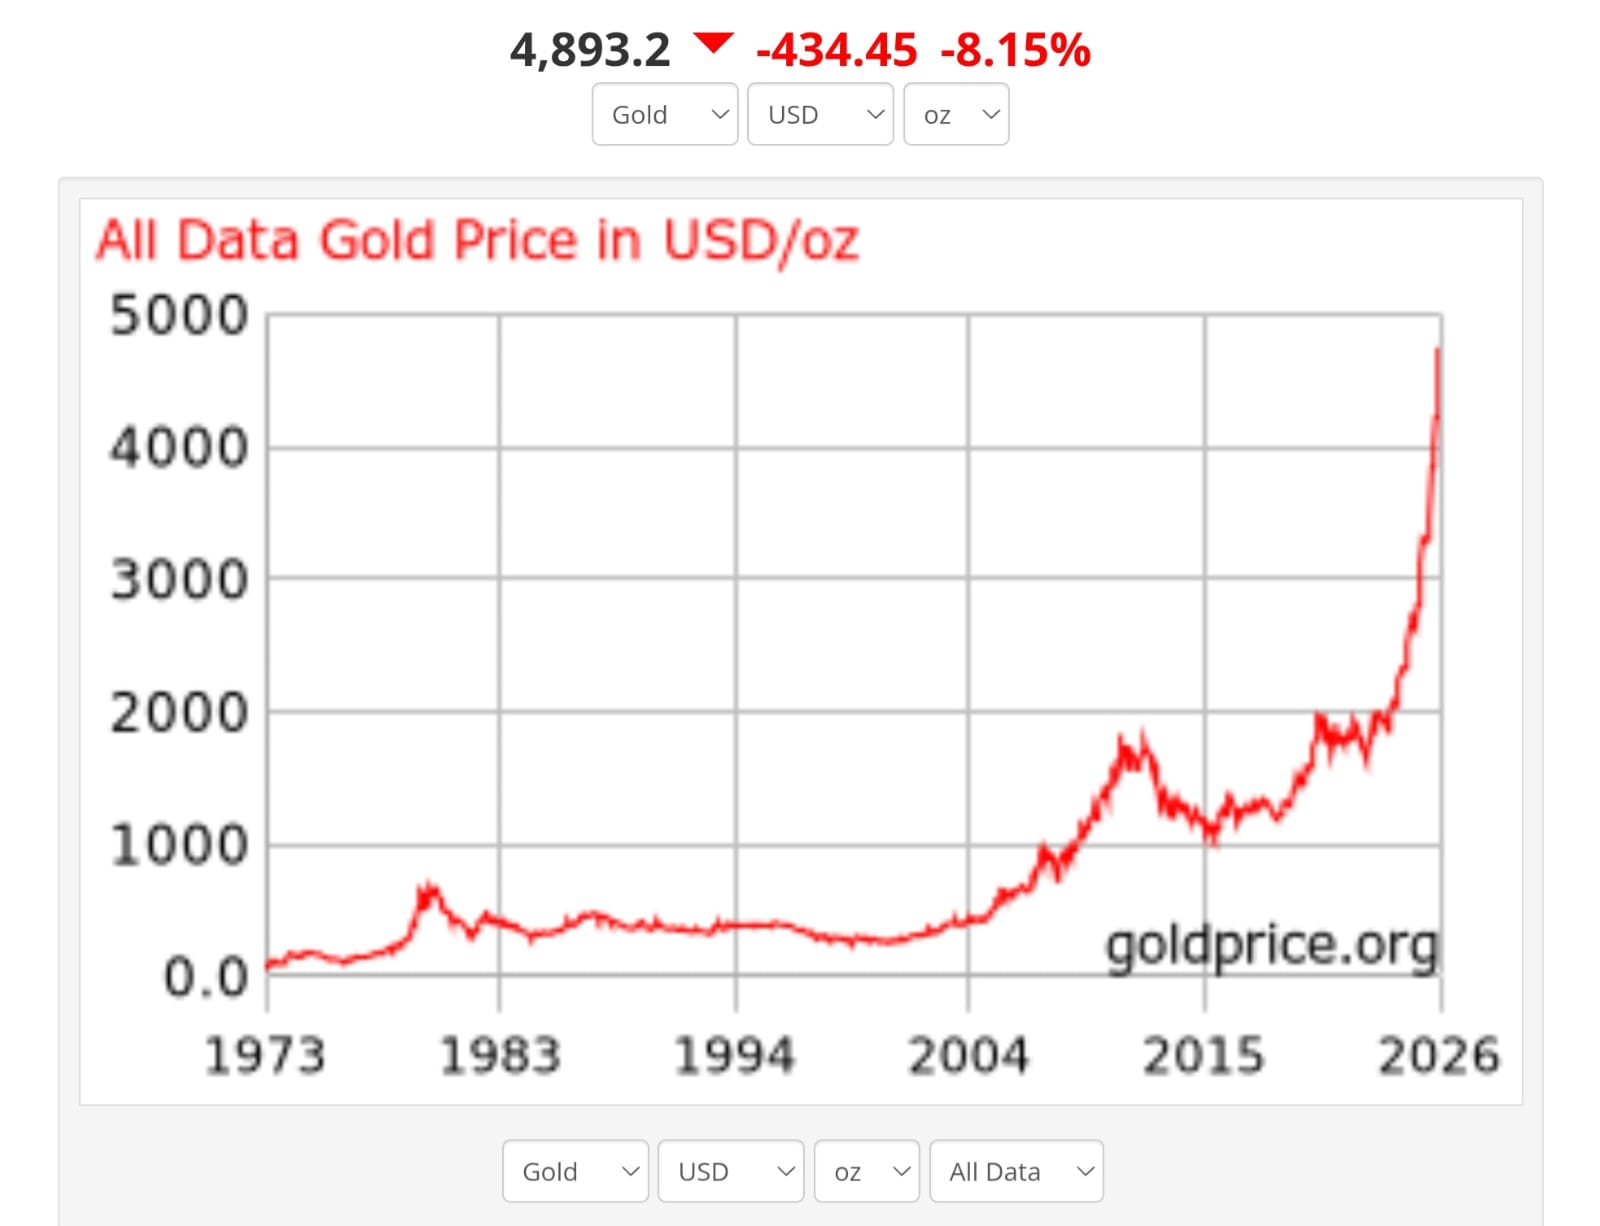
Gold's Behavior: Throughout late 2024 and 2025, Gold aggressively broke past historical resistance ($2,100, $2,400, and beyond), driven by central bank buying (China, Poland, Singapore) and fears of US debt sustainability.
The Anomaly: As of early 2026, while Gold is at or near record highs, many industrial commodities (specifically energy and base metals) have remained relatively cheap compared to historical ratios.
What History Says Comes Next (2026 Outlook)
If the 1970s and 2000s are the roadmap, we are currently in the "Catch-Up" window.
- The Gold-to-Oil Ratio: Historically, this ratio reverts to mean. With Gold high and Oil stabilized, Oil is mathematically "cheap" in gold terms.
- The Rotation: Capital often rotates from the "safety" of Gold into the "risk" of cyclical commodities once inflation expectations become entrenched.
- Silver's Role: Silver usually acts as the bridge. It is both a monetary metal (like Gold) and an industrial metal (like Copper). In 2026, we are seeing Silver act with high volatility, often a precursor to a broader industrial commodity move.
Investment Action Plan
Based on historical repetitions from 1928 to 2026, here is the strategic insight:
| Asset Class | Historical Status | 2026 Insight |
|---|---|---|
| Gold | Leading Indicator | Likely remains in a secular uptrend but may pause/consolidate. It has done its job of signaling currency weakness. |
| Silver | The Lagging High-Beta | Historically outperforms Gold in the second half of the cycle. Look for industrial demand (Green Energy/AI hardware) to drive this. |
| Energy (Oil/Gas) | The Catch-Up Play | Often undervalued relative to Gold at this stage. Supply constraints (underinvestment in capex) make this a strong hedge. |
| Copper/Metals | The Economy Play | If global liquidity rises to support debt (lowering rates), hard assets like Copper tend to surge to close the gap with Gold prices. |
Conclusion
The history of the last 98 years (1928–2026) teaches us one clear lesson: Gold marks the change in the value of money; Commodities mark the change in the cost of living.
We have already seen the change in the value of money (Gold soaring). The "cost of living" adjustment in raw materials usually follows. A diversified portfolio in 2026 should not just hold Gold, but should look closely at the tangible assets that have not yet repriced to reflect the new monetary reality.